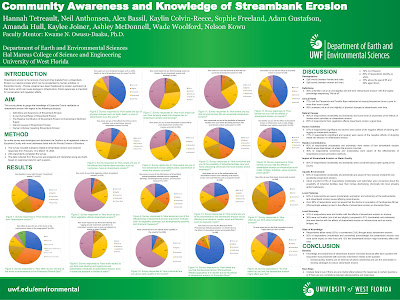
For the final project of Photo Interpretation and Remote Sensing we were tasked with performing manual or automated image processing techniques on remotely sensed data. The landsat imagery for this project was
obtained from USGS.com utilizing their GIS database known as Earth Explorer. The imagery I chose was captured by the Sentinel
II satellite. Preprocessing techniques for this project
involved clipping, scaling and visualizing the imagery to assess for estuary
location, bay shape, water color gradient, and tidal influx/outflux.Programs utilized to perform this analysis included
Erdas Imagine and ArcMap. Utilizing Erdas Imagine I was able to perform a
supervised classification for the study areas of Pond 6 and Saultsman Cove.
Utilizing ArcMap I was able to create the following map deliverable, a combination of two maps showing study area, supervised classification,
state extent, and spectral Euclidean distance for the two selected estuaries.
An overall dark Euclidean distance output being indicative of pixels that have
a higher likelihood of being classified correctly. My map, displayed below,
contains not only all deliverable map elements including scale bar, north
arrow, study area extent, legends, credit, and author, but also class area and
total area derived from tables created and imported from Excel after analyzing
attribute table data added in Erdas for each respective study area. In conclusion, I found this project to be an
accurate assessment for testing an array of GIS skills related to land use land
classification. In performing this sediment deposition analysis I have learned
that by analyzing pixel coloration one can determine sediment deposition
accurately. Sediment deposition rate was assessed for by analyzing the area
values for high, medium, and low sediment classifications for each respective
study area, and Pond 6 was found to have a higher chance at silling up the
quickest.


No comments:
Post a Comment