Friday, September 28, 2018

GIS 4930 - Project 2 - Mountaintop Removal: Analyze

For this week's portion of Project 2: Mountaintop Removal we were tasked with analyzing land satellite imagery. For rhis project I worked with the following programs: arcMap and Erdas, to create these data sets.
The map I created for this week was accomplished by combining multiple landsat images into a single file and classifying all Mountaintop Removal Sites within group 4's study area using the unsupervised classification tool and editing attribute data, using Erdas. Then importing into arcMap to use the reclassify tool to reclassify all MTR data and remove all NON MTR data. Attached is my deliverable for project 2 MTR: analyze.


Tuesday, September 25, 2018

GIS 4035 - Module 4 - Ground Truthing

This week in photo interp. & remote sensing we were tasked with performing an accuracy assessment of the classification area, also known as ground truthing, for module 4.
This assessment builds off of last weeks LU/LC module 2. 30 assessment points were chosen using a random selection method taking care to evenly distribute the points throughout the classification area. Out of the 30 points selected 6 were categorized as error (n) and 24 were categorized as correct (y).
This assessment resulted in an accuracy calculation of 80%.


Friday, September 21, 2018

GIS 4930 - Project 2 - Mountaintop Removal: Prepare

For this week in Special Topics, we were tasked with creating story maps, forming into groups, and analyzing digital elevation model data.
For this weeks section of project 2 we mainly focused on preparing and getting into a group. My group is group 4 and occupies the SE quadrant of the study area. 
We were also tasked with preparing two story maps that highlight the steps involved in mountaintop removal mining and the steps involving the finished project such as background info, study site, analysis and discussion.

UPDATE: After importing my map files into arcMap and rerunning all tools required to recreate the hydro data files I was successfully able to create the required deliverable for project 2, A single map showing both streams data frame and basins data frame. I've also included a data frame that shows my quadrant (n36_w083_3arc_v1.tif) of group 4's study area for the mountain top removal project.


Wednesday, September 19, 2018

GIS 4048 - Module 1 Project 1

For module 1 project 1 we were tasked with creating a route map in response to an overturned tractor trailer accident. This proposed incident response message was created in order to distribute to motorists in the area in response to the accident:
"Attention all motorists. An incident involving an overturned tractor trailer has rendered the intersection of Interstates 95 and 945, in Springfield, Virginia, untraversable. As such the following detours have been issued: North to South 3.5 miles, South to East 3.8 miles, South to West 9.8 miles. Please allow for at least a 10 minute delay in your travels today. Thank you."

This map shows detour routes around the incident, proposes routes to designated shelters, informs motorists the extent of the accident, highlights locations of nearby fire stations and all major roadways, shows nearest shelter in color code.

This map was uploaded to arcgisonline.com - 
https://arcg.is/0Kviu9


Tuesday, September 18, 2018

GIS 4035 - Module 3 - LULC classification

For this weeks project, module 3, in GIS 4035 we were tasked with created a land use / land cover classification map for a provided aerial image file. A LULC level II code format was followed and the following codes were applied to the study area and the reasoning for why:


11- Residential - areas that contained buildings that were smaller than commercial size
12 - Commercial and Services - areas that contained larger than home sized buildings and large parking lots
14 - Transportation - main highway
43 - Mixed forest land - all woodland area was categorized under this classification of mixed
51 -  Streams and Canals - smaller streams leading from the bay were categorized as this
53 - Reservoirs - a few small retention ponds in the residential area
54 - Bays and Estuaries - the bay
62 - non-forested wetland - wetland area surrounding the bay that had no trees


GIS 4035 - Module 2 - Visual Interpretation

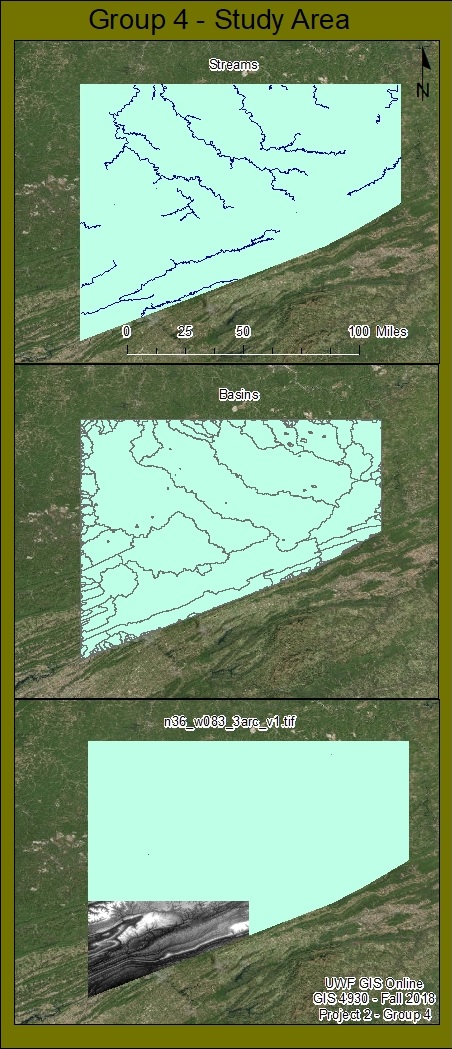
For my first project in GIS 4035 Photo Interpretation and Remote Sensing, we were tasked with analyzing and interpreting 3 different aerial images.
For the first .tif aerial image file we were tasked with interpreting tone, by classifying 5 polygon feature class files from very light to very dark, and texture, by classifying 5 polygon feature class files from very fine to very coarse.
The following map deliverable was created.

For the next .tif aerial image file we were tasked with interpreting features based on shape, shadow, pattern, and association.  The following map deliverable highlights each of the mentioned features and indicates the color code for that feature in the legend.


For the final .tif aerial image file we were tasked with interpreting color features when compared to a false color IR image of the same study area. The following differences were noted:

Feature
True Color
False Color
Stream
White
Blue
Forest
Green
Red
River
Green-blue
Blue
Building
Light-grey
White
Lot
Dark-grey
Blue

Friday, September 14, 2018

GIS 4930 - Project 1 Network Analyst

Alot has happened during the first couple weeks during my start into this GIS 4930 Special Topics GIS course. Me and my wife welcomed our new born son into the world, and as such I was given a week extension for the first deliverables of project 1. Since I have completed week 1 and week 2 deliverables during week 2 I am posting the entirety of project 1 in this blog post.

Project 1 Network Analyst had tasked us with creating 6 maps that involved routing, network analysis, and a multitude of refresher lessons from previous GIS courses.

For week 1, I created a Hurricane Get Ready Guide to serve as a general map highlighting all evacuation and supply routes in the Tampa Bay, Fl area in the event of a natural disaster or state of emergency. The data-set also highlights the location of all police departments, fire departments, shelters, hospitals, roads, and waterways within the study area.

For week 2, I created routes for hospital evacuation, from Tampa Bay General Hospital to two nearby hospitals in the Tampa Bay, Fl area, Memorial Hospital, and St. Josephs Hospital, and routes for emergency personnel to transport supplies from the National Guard Armory to three nearby designated shelters, Middleton High School, Tampa Bay Blvd. Elementary School, and Oak Park Elementary School. 

All information was presented accurately and legibly in order to present an easy to follow guide that anyone could pick up and follow during times of distress in the Tampa Bay, Fl area. 


Spring 2023 semester wrap up

 The spring 2023 semester at UWF has been an eventful one in which I finalized the requirements for my bachelors of science in natural scien...