Showing posts with label GIS 4930. Show all posts

Tuesday, December 11, 2018

GIS 4930 - Project 4 - Navarre Food Desert Analysis

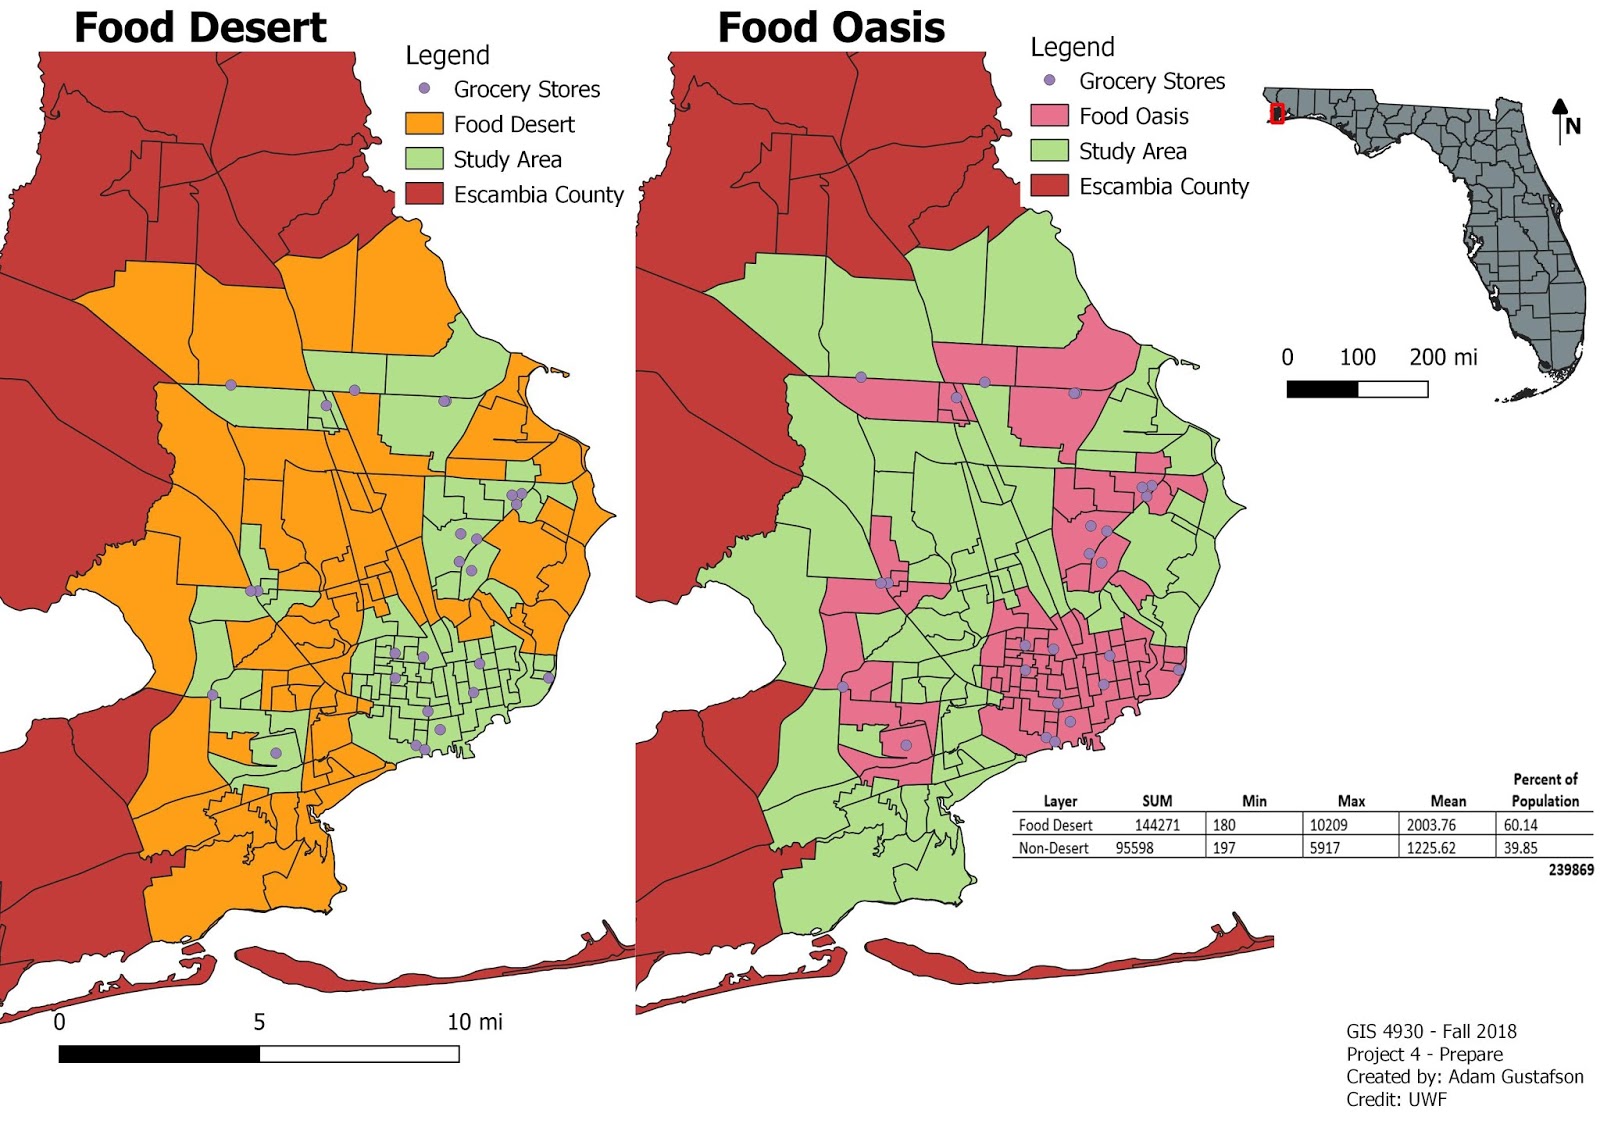
    A food desert can be described as an area in a community that has succumbed to health degradation as a result of no nearby nutritional sources.

    For the final portion of Project 4 we were tasked with assembling all of our food desert data into one concise power point presentation dedicated to highlighting our food desert area and illustrating how it is effecting the community. I chose my hometown of Navarre, Florida for the study area to my Food Desert Analysis. Navarre is approximately 84.83 square miles in area and 9 grocery stores were identified for this analysis.
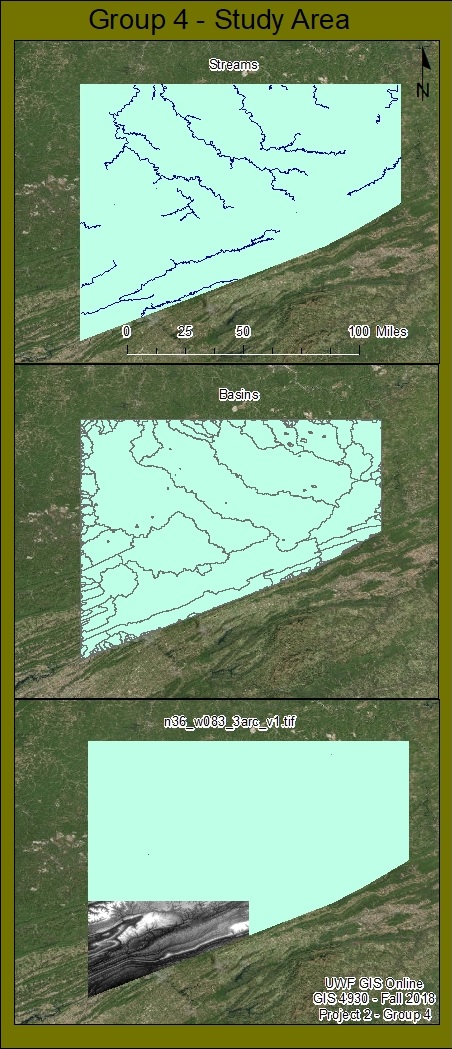
GIS programs involved in this analysis included utilizing: ArcMap, Qgis, Leaflet, and Mapbox. Methods involved creating shapefiles for food deserts and grocery stores in Navarre. Shapefiles were uploaded into Mapbox as tilesets and displayed in Leaflet. Arcmap was used to create the study area map. The most challenging technique in this project involved having to create the Navarre food desert shape file. A new Near.csv to reference object id’s within 1 mile and unique to Navarre had to be created along with a new set of centroids.
The data being displayed indicates that grocery stores in Navarre are restricted mainly to highway 98. This restriction creates food deserts the farther north you travel from highway 98. I used my local town and the data does not surprise me. I knew that most grocery stores were located either directly on highway 98 or within at least 1 mile.

Food Desert = 51.67 % of total population
Food Oasis = 48.32 % of total population

    From these results one might conclude that Navarre is suffering from a food desert issue but this is not necessarily true. Yes the majority of land cover in Navarre is designated as food desert but the accessibility of highway 98 needs to be taken into account. All of these grocery stores are located less than a mile from highway 98 the main life line of Navarre. The accessibility of these grocery stores allows for Navarre to not be effected as drastically by food desert areas in regards to health and well being. 

    Navarre is a rapidly growing tourist driven town. There is no way that Navarre is suffering from negative health effects brought upon by inner community food desert intensification. This analysis has revealed that Navarre is majority food desert by total population but the accessibility of grocery stores off sets these food deserts by being located directly on Highway 98, the life line of the Gulf Coast. This analysis has shed light onto areas that can potentially benefit from grocery store construction in Navarre, Florida but like I said before Navarre is not under a food desert threat.


Friday, December 7, 2018

GIS 4930 - Project 4 - Analyze 2- Food Deserts

For this weeks portion of project 4 we were asked to create a webmap in leaflet for food deserts in an area of our choosing. I chose Navarre, FL, my hometown as the study area for my food desert analysis.
I obtained my data using www.fgdl.com I searched florida census and downloaded

       2010 U.S. CENSUS BLOCKS IN FLORIDA
CENBLK2010_AUG11
                
The extent of the processing I did involved clipping the data to a shapefile of santa rosa county then selecting for all object ID’s within Navarre in order to create a study area shapefile.
For the grocery store shapefile I used ArcGIS and the coordinate inquiry box in order to zoom to the coordinates of all grocery stores in Navarre. I obtained coordinates using google maps. Once the coordinate inquiry located  a grocery store location I would put a point using the ArcGIS editor on a newly created navarregrocerystores.shp.

The data being displayed indicates that grocery stores in Navarre are restricted mainly to highway 98. This restriction creates food deserts the farther north you travel from highway 98. I used my local town and the data does not surprise me. I knew that most grocery stores were located either directly on highway 98 or within at least 1 mile.

http://students.uwf.edu/atg6/GIS/navarre_fooddesert.html

Friday, November 30, 2018

GIS 4930 - Project 4 - Analyze - Food Deserts

For this weeks portion of Project 4 we were tasked with taking the food desert and grocery store shape file data we created last week and uploading them into two open source web map making programs, Mapbox and Leaflet.
Using mapbox I was able to design a layout with a graduated symbology split into five classes based on  fooddesert.shp's pop2000 field.

Using the quickstart guide, and the project procedures I was able to create a marker displaying 2 text lines, a circle in a food oasis area, and a 4 coordinate polygon in a food desert area.

Some problems that I ran into over the course of this weeks project include: not being able to locate the correct mapbox to leaflet link required to transfer the maps tileset. Therefore my fooddeserts and grocerystores files are not displayed on my leaflet map.


Link to mapbox map displaying tileset


Friday, November 23, 2018

GIS 4930 - Project 4 - Prepare - Food Deserts

"food desert"     
an urban area in which it is difficult to buy affordable or good-quality fresh food.
-dictionary.com

For this weeks portion of project 4 we were tasked with preparing two maps, using Qgis , showing areas in Escambia county that would be considered food areas or food deserts. Areas were subjected to a proximity selection based on nearness to grocery stores. The following deliverables were created in qgis: a map showing Escambia county and UWFs location and a map showing food deserts and food oasis with the project 4 study area as background. The following population statistics were calculated : food desert 60.14% of total pop, food oasis 39.85% of total pop.


Friday, November 2, 2018

GIS 4930 - Project 3: Analysis - Statistical Analysis of Methamphetamine Laboratory Busts

For this week's portion of Project 3 we were tasked with running an Ordinary Least Square regression on our data compiled in the previous week.
An ordinary least square regression method involves comparing a dependent variable (meth lab density) and explanatory (independent) variables. The explanatory variables consist of census data and the following variables were chosen: Males, Females, Age_18_21, Age_22_29, Age_30_39, Age_40_49, Age_50_64, Age_65_ Up, Hsehld_1_M, Hsehld_1_F, HSE_Units, and Vacant. The following variables were chosen based on review of the following three resulting values: Probability, Coefficient, and VIF. Values with probability > 1.0 were immediately removed as these values indicate low statistical significance. Variable coefficient values were taken into account as they indicate the relationship between the dependent variable and the explanatory variables indicating a strong or weak relationship. VIF values indicate overrepresentation or overlapping data amongst similar explanatory variables. Variables Males, Females, and HSE_Units all had a high VIF value as they were overrepresented in the census data. This does not necessarily denote a negative aspect seeing as how all participants had to choose one of two choices, Male or Female. This overrepresentation indicated from high VIF values is to be expected.

Attached is my results for OSL results displayed as STDResidual on the study area map and my OSL results in table form


Friday, October 19, 2018

GIS 4930 - Project 3: Prepare - Statistical Analysis of Methamphetamine Laboratory Busts

"Most illicit drugs present two serious problems for society. First are the many consequences of drug use for the user, the community, and society as a whole. Second is the violence that accompanies the business of drugs that are transported across national borders through elaborate networks. Methamphetamine contributes to both problems, but in many parts of the country it presents another serious problem, namely the social and environmental damage that comes from domestic methamphetamine production." Methamphetamine Laboratories: The Geography of Drug Production - Ralph A. Weisheit and L. Edward Wells

For this week’s portion of Project 3: Prepare, we were tasked with preparing for a Statistical Analysis of Methamphetamine Laboratory Busts in West Virginia, USA. The final report for this module will consist of a fully constructed multi paged scientific analysis of the West Virginia study area comparing specific census tract demographics to the location of reported meth lab clusters. This analysis will serve to solidify any doubt in regards to medical, property and economical damage, that this drug and the drugs creation processes has wrought on West Virginia over the last few decades. I look forward to performing this analysis and to next week’s ordinary least square regression model creation.


Below is a constructed basemap of the study area with all essential map elements for the module 3 project.


Sunday, October 14, 2018

GIS 4930 - Project 2 - Mountaintop Removal: Report

“There is always going to be ambiguity in image classification based on data quality, tools being used and judgments made by the interpreter. Perfection is impossible.” -Skytruth President, John Amos

Finally, after three weeks of data compiling, classifying, and assessing project 2: MTR is complete. For this weeks portion of project 2 I classified mountain top removal sites for path 17 row 34 in group 4's study area for the WV, Appalachian Coal Region Mountaintop Removal Project.
My results were as follows:
Accuracy: 90%
Total Acreage: 21243.2 square acres
Acreage difference between 2005 and 2015 MTR analysis : + 2908.8 square acres
Group Results:
Total Group Acreage: 137668.86 square acres
Total Group Accuracy: 85%

Attached is a screenshot of a map showing my completed layer package.


Link to MTR: Arcgis Online Analysis Map

Friday, September 28, 2018

GIS 4930 - Project 2 - Mountaintop Removal: Analyze

For this week's portion of Project 2: Mountaintop Removal we were tasked with analyzing land satellite imagery. For rhis project I worked with the following programs: arcMap and Erdas, to create these data sets.
The map I created for this week was accomplished by combining multiple landsat images into a single file and classifying all Mountaintop Removal Sites within group 4's study area using the unsupervised classification tool and editing attribute data, using Erdas. Then importing into arcMap to use the reclassify tool to reclassify all MTR data and remove all NON MTR data. Attached is my deliverable for project 2 MTR: analyze.


Friday, September 21, 2018

GIS 4930 - Project 2 - Mountaintop Removal: Prepare

For this week in Special Topics, we were tasked with creating story maps, forming into groups, and analyzing digital elevation model data.
For this weeks section of project 2 we mainly focused on preparing and getting into a group. My group is group 4 and occupies the SE quadrant of the study area. 
We were also tasked with preparing two story maps that highlight the steps involved in mountaintop removal mining and the steps involving the finished project such as background info, study site, analysis and discussion.

UPDATE: After importing my map files into arcMap and rerunning all tools required to recreate the hydro data files I was successfully able to create the required deliverable for project 2, A single map showing both streams data frame and basins data frame. I've also included a data frame that shows my quadrant (n36_w083_3arc_v1.tif) of group 4's study area for the mountain top removal project.


Friday, September 14, 2018

GIS 4930 - Project 1 Network Analyst

Alot has happened during the first couple weeks during my start into this GIS 4930 Special Topics GIS course. Me and my wife welcomed our new born son into the world, and as such I was given a week extension for the first deliverables of project 1. Since I have completed week 1 and week 2 deliverables during week 2 I am posting the entirety of project 1 in this blog post.

Project 1 Network Analyst had tasked us with creating 6 maps that involved routing, network analysis, and a multitude of refresher lessons from previous GIS courses.

For week 1, I created a Hurricane Get Ready Guide to serve as a general map highlighting all evacuation and supply routes in the Tampa Bay, Fl area in the event of a natural disaster or state of emergency. The data-set also highlights the location of all police departments, fire departments, shelters, hospitals, roads, and waterways within the study area.

For week 2, I created routes for hospital evacuation, from Tampa Bay General Hospital to two nearby hospitals in the Tampa Bay, Fl area, Memorial Hospital, and St. Josephs Hospital, and routes for emergency personnel to transport supplies from the National Guard Armory to three nearby designated shelters, Middleton High School, Tampa Bay Blvd. Elementary School, and Oak Park Elementary School. 

All information was presented accurately and legibly in order to present an easy to follow guide that anyone could pick up and follow during times of distress in the Tampa Bay, Fl area. 


Spring 2023 semester wrap up

 The spring 2023 semester at UWF has been an eventful one in which I finalized the requirements for my bachelors of science in natural scien...