Tuesday, September 18, 2018

GIS 4035 - Module 2 - Visual Interpretation

For my first project in GIS 4035 Photo Interpretation and Remote Sensing, we were tasked with analyzing and interpreting 3 different aerial images.
For the first .tif aerial image file we were tasked with interpreting tone, by classifying 5 polygon feature class files from very light to very dark, and texture, by classifying 5 polygon feature class files from very fine to very coarse.
The following map deliverable was created.

For the next .tif aerial image file we were tasked with interpreting features based on shape, shadow, pattern, and association.  The following map deliverable highlights each of the mentioned features and indicates the color code for that feature in the legend.


For the final .tif aerial image file we were tasked with interpreting color features when compared to a false color IR image of the same study area. The following differences were noted:

Feature
True Color
False Color
Stream
White
Blue
Forest
Green
Red
River
Green-blue
Blue
Building
Light-grey
White
Lot
Dark-grey
Blue

Friday, September 14, 2018

GIS 4930 - Project 1 Network Analyst

Alot has happened during the first couple weeks during my start into this GIS 4930 Special Topics GIS course. Me and my wife welcomed our new born son into the world, and as such I was given a week extension for the first deliverables of project 1. Since I have completed week 1 and week 2 deliverables during week 2 I am posting the entirety of project 1 in this blog post.

Project 1 Network Analyst had tasked us with creating 6 maps that involved routing, network analysis, and a multitude of refresher lessons from previous GIS courses.

For week 1, I created a Hurricane Get Ready Guide to serve as a general map highlighting all evacuation and supply routes in the Tampa Bay, Fl area in the event of a natural disaster or state of emergency. The data-set also highlights the location of all police departments, fire departments, shelters, hospitals, roads, and waterways within the study area.

For week 2, I created routes for hospital evacuation, from Tampa Bay General Hospital to two nearby hospitals in the Tampa Bay, Fl area, Memorial Hospital, and St. Josephs Hospital, and routes for emergency personnel to transport supplies from the National Guard Armory to three nearby designated shelters, Middleton High School, Tampa Bay Blvd. Elementary School, and Oak Park Elementary School. 

All information was presented accurately and legibly in order to present an easy to follow guide that anyone could pick up and follow during times of distress in the Tampa Bay, Fl area. 


Tuesday, August 28, 2018

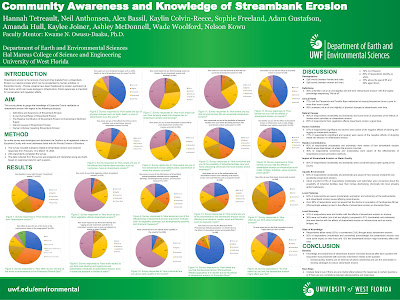
Fall semester 2018 update: Craton poster

I am currently entering the 2018 Fall semester and I wanted this post to serve as a catch up for my GIS projects that I have completed since.
During the Spring semester of 2018 I was enrolled in GEO4332 Senior Seminar and completed a multitude of projects that involved preparing me for assessing a proper career path. 
Projects completed ranged from: Creating a linkedin account, tuning up my resume, creating cover letters, engaging in mock interviews, and creating/presenting my Senior Seminar final project, at the UWF Student Scholar Symposium, on a 4 x 3 poster, a topic of our choosing.
The topic that I chose was mineral composition for the craton region known as the Slave Craton, located in the, northern-central, Canadian territory of Nunavut. 
For my project I utilized this dataset that involved the compilation of many geological maps ranging from core sample data to satellite magnetic imagery compiled over the years.
By adjusting the attribute data I was able to create three layers, of the Slave Craton map, that displayed the geological rock ratio of the craton: Sediment, metamorphic and igneous. 
For this project I utilized two software programs: arcMAP and Microsoft publisher.
In creating this Senior Seminar final poster I utilized my entire GIS skillset in order present this data accurately and aesthetically.


Wednesday, December 13, 2017

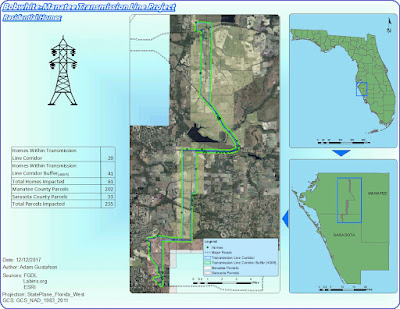
INTRO GIS4043 - Final Project - Bobwhite-Manatee Transmission Line

"Transmission line buffer corridors or buffer zones are the area below, and around,
transmission lines in which activities and land uses that are incompatible with the safe and
efficient operation of the national electricity transmission network are avoided."
             -Sep. 2012, "Q&A: Transmission Line Buffer Corridors", Transpower

For the GIS4043 Intro to GIS lab final project we were tasked with creating 5 impact maps that assess the following proposed conditions regarding the installation of the Bobwhite Transmission Line, that runs from Manatee county, Florida to Sarasota county, Florida.  
-It has relatively few homes in close proximity.
-It generally avoids schools and school sites.
-It avoids large areas of environmentally sensitive lands.
          Conservation lands and wetlands.
-The line can be built along this route for a reasonable cost. 


The Bobwhite-Manatee Transmission Line Project was completed only after applying             multiple skills learned and mastered through study and persistence in Arcmaps. Not only       were the 5 presented maps assessed for but also an array of design elements were considered in the construction of this impact report. 

This semesters introduction to GIS has proven to be one of the most beneficial and creative expressive classes I've ever taken. I personally have enjoyed learning an array of GIS skills that I plan to carry on with me in to not only future GIS courses but all projects that are environmental science related. 

Power Point Presentation - http://students.uwf.edu/atg6/GIS/BWMTLP_powerpoint.pptx

Slide by Slide Script - http://students.uwf.edu/atg6/GIS/BWMTLP_slidebyslide.pdf


Tuesday, November 21, 2017

INTRO GIS4043 - Lab 12 Georeferencing, Editing and Arcscene

Reference - use of a source of information in order to ascertain something
-Dictionary.com 

In this weeks lab we were tasked with georeferencing a dataset of the buildings on UWF campus with an aerial imagery raster file of the UWF campus. This involved adding multiple control points to reference the unknown raster image to the UWF building feature class. We were then tasked with creating an inset map of a nearby protected eagle nest and create a compound buffer consisting of a 330 foot ring and 660 foot ring around the eagle nest point. I then added another inset to reference where the eagle nest is in relation to the globe. Our second map deliverable involved utilizing Arcscene to recreate the UWF buildings feature class layer in a 3d environment. Building 072 and Campus Lane were highlighted to show created digitized features.


Thursday, November 16, 2017

INTRO GIS4043 - Lab 11 Network Analysis and Model Builder

Understanding how to to use the tools you are given is more important than understanding how to finish a job.

In this weeks lab we were tasked with learning the ins and outs to ultimately understand Geocoding and Model Builder in ArcMaps. 

The map I created utilizes a number of techniques built upon each other utilizing the geocoder in Arcmaps. The map itself is of Lake County, Florida and highlights an optimal route to take between three EMS sites. The map contains two data frames, the main data frame being the optimal route zoomed in view and the second being a county wide view highlighting the extent indicators for the route and all other EMS sites located within Lake County, Florida. 

Geocoding can be difficult because it requires multiple files in order to be used effectively. The first and foremost step was to create an Addresslocator or a compiled list of EMS sites and there locations ready for geocoding imported from the excel sheet$1 file. This process involved manually selecting address locations for a number of sites using the "pick address from map" feature in the network analysis toolbar. Once all addressees were defined and a route was solved my EMS route map was practically finished.  Here is the final results.


Thursday, November 9, 2017

INTRO GIS4043 - Lab 10 Vector Analysis

"Vector - A coordinate-based data model that represents geographic features as points, lines, and polygons."
-ESRI

For the last two weeks we have been analyzing and working with vectors and an array of tools and processes for interacting with them in ArcMap. Week 9 had us identifying geodatabases and creating feature class shapefiles, running attribute queries, using the statistic tool in the attribute table, and executing a spatial join to merge attribute table data from two layers into one. Week 10 continued with the theme of vector data manipulation by having us utilize buffer and overlay, identifying the six overlay tools, used to manipulate two features to form a new one,  form a singlepart layer from a multipart, and create a map incorporating all skills learned over the two weeks.

My map is titled Potential Campsite Locations and is made up of multiple layers overlayed with certain attribute data selected for to create the parameters notated on the map below. 


Wednesday, October 25, 2017

INTRO GIS4043 - Lab 7-8 Data Search Midterm

"Success is the result of perfection, hard work, learning from failure, loyalty, and persistence." -Colin Powell

Over the last two weeks we were assigned a Florida county and tasked with creating a set of maps that would display the following data: roads, rivers, county boundaries, city names, public lands, digital elevation model image, digital orthophoto quarter quadrangle image, and two environmental categories. The county that I was assigned was Manatee County. I chose wetlands and invasive species for the two environmental shapefiles. 
After compiling all of the data from multiple databases including: Labins.org, FGDL.org, and nationalmap.gov, I came to the conclusion that three maps would be the best for displaying all of this data.
My first map consists of wetlands locations and species that occupy these areas. I constructed this map from a single data frame and transformed all shapefiles to the single projection of

NAD_1983_2011_StatePlane_Florida_West_FIPS_0902_Ft_US. On this map I included shapefiles for rivers, roads, county boundaries, wetlands,and species. A DOQQ consisting of 4 quadrants (2919) was also added to this map in order to show some terrain features of one of the larger wetlands areas.
My second map consists of state park locations within the boundaries of Manatee County. This map was constructed with two data frames so a shapefile of the state of florida could be displayed with the location of Manatee County highlighted to show location. All shapefiles on the stateparks map were transformed in order to maintain a single projection. City names and state parks were labeled and displayed via a legend in order to display information effectively.   
My third map consists of a digital elevation model clipped to the boundaries of Manatee County.
This final step in the project proved to be the most challenging. In order to obtain a proper clip I had to export a shapefile of Manatee County separating it from the County Boundary file of the entirety of Florida. Once this was achieved I was able to use the Clip (data managment) tool to clip the raster file to conform to the shape of Manatee County perfectly. A suitable elevation gradient color was chosen to reflect low areas as greenish shades and higher areas as reddish shades.
Overall this project was dense but as is to be expected for a two week midterm. I am pleased with the outcome.


Success is the result of perfection, hard work, learning from failure, loyalty, and persistence. Colin Powell
Read more at: https://www.brainyquote.com/quotes/keywords/persistence.html
Success is the result of perfection, hard work, learning from failure, loyalty, and persistence. Colin Powell
Read more at: https://www.brainyquote.com/quotes/keywords/persistence.html

Thursday, October 5, 2017

INTRO GIS4043 - Lab 6 Projections Continued

Understanding that every projection distorts is the key to figuring out which projection you need to use.

In this weeks lab we were tasked with creating multiple shapefiles from a multitude of sources and assembling all of this information into a single .mxd in Arcmaps with a uniform projection. To begin we were introduced to two data storage sites, Labins.org and FGDL.org. These websites specialize in storage and download of Florida mapping files, including but not limited to aerial photography, wildlife distribution, roads, rivers, and a multitude of other files.
For my final submission I used Labins.org to pull four aerial photography files in raster form (.sid) for quadrant 5159 in Escambia county Florida. These four quadrant files (NE,NW,SE, and SW) were projected as NAD_1983_StatePlane_Florida_North_FIPS_0903_Feet and applied as four seperate layers.
The second layer of my final submission required the use of FGDL.org in order to download a shapefile of Floridas major roads. This data file came projected in Albers Conical Equal Area but through the use of the project(data management) tool the file was reprojected to NAD_1983_2011_StatePlane_Florida_North_FIPS_0903_Ft_US. 
The third layer consisted of county boundaries with the above mention state plane projection. 
The fourth layer consisted of stateplane quadrants reprojected in the above mentioned state plane projection.
The fifth and final layer involved conversion of an excel data sheet of petroleum storage tank contamination monitoring sites in Escambia County into a shapefile and imported over the existing layers. For this data sheet to align correctly the given coordinates (in DMS) were converted into decimal degrees and imported into Arcmaps with the WGS_1984 projection then reprojected into the above mentioned state plane projection.

The final result (pictured below) resulted from the understanding of projections, the project(data managment) reprojection tool, and accessing data files in the above mentioned data storage websites. 


Spring 2023 semester wrap up

 The spring 2023 semester at UWF has been an eventful one in which I finalized the requirements for my bachelors of science in natural scien...